
⛳ Chipata is situated in or near the subtropical dry forest biome.
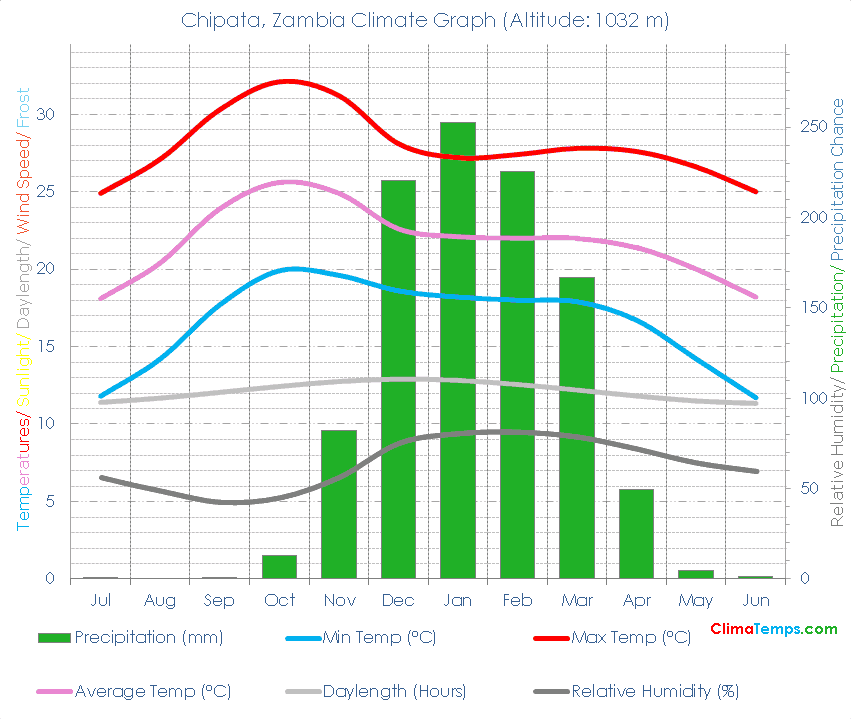
🌡️ The average temperature is 21.8 degrees Celsius (71.2 degrees Fahrenheit). See the temperatures page for a monthly breakdown and the fixed scale graph.
🐬 Average monthly temperatures vary by 7.5 °C (13.5°F). This indicates that the continentality type is hyperoceanic, subtype barely hyperoceanic.
☔ Total annual precipitation averages 1016.9 mm (40 inches) which is equivalent to 1016.9 Litres/m² (24.94 Gallons/ft²).
Simply paste the following HTML code into your webpage. Please include a link back to this website. There is one in the following code already. Edit the width attribute to change the size of the graph if needed:
✨ The longest day of the year is 12:47 long on the 21 of December and the shortest day is 11:12 long on the 22 of June.
🐇Were you to burrow down through the centre of the Earth from Chipata you would pop up nearest to the climate station at Hilo, (Big Island), Hawaii, Hawaii where you would find a Tropical wet climate (Subtropical dry forest biome).
🌍Chipata, Zambia is at 13°33'S, 32°35'E, 1032 m (3386 ft). Check the location on the map.
| Climate Variable | Jul | Aug | Sep | Oct | Nov | Dec | Jan | Feb | Mar | Apr | May | Jun | Annual | ||
|---|---|---|---|---|---|---|---|---|---|---|---|---|---|---|---|
| Average Max Temperature °C ( °F) | 25 (77) | 27 (81) | 30 (87) | 32 (90) | 31 (88) | 28 (83) | 27 (81) | 27 (81) | 28 (82) | 28 (82) | 27 (80) | 25 (77) | 28 (82) | ||
| Average Temperature °C ( °F) | 18 (65) | 20 (69) | 24 (75) | 26 (78) | 25 (77) | 23 (73) | 22 (72) | 22 (72) | 22 (72) | 21 (71) | 20 (68) | 18 (65) | 22 (71) | ||
| Average Min Temperature °C ( °F) | 12 (53) | 14 (58) | 18 (64) | 20 (68) | 20 (67) | 19 (65) | 18 (65) | 18 (64) | 18 (64) | 17 (62) | 14 (58) | 12 (53) | 17 (62) | ||
| Average Precipitation mm (in) | 0 (0) | 0 (0) | 1 (0) | 13 (1) | 82 (3) | 221 (9) | 253 (10) | 225 (9) | 167 (7) | 50 (2) | 4 (0) | 1 (0) | 1017 (40) | ||
| Average Daylight Hours/ Day | 11h 24' | 11h 40' | 12h 02' | 12h 25' | 12h 44' | 12h 54' | 12h 49' | 12h 33' | 12h 11' | 11h 48' | 11h 29' | 11h 19' | 12h 00' | ||
| Sun altitude at solar noon on the 21st day (°). | 56 | 64.4 | 75.7 | 85.3 | 82.8 | 80.1 | 83.1 | 85.5 | 76.1 | 64.6 | 56.2 | 53 | 71.9 |
Please take a moment to share a climate graph or simply the address:
Thank You, so much! ❤️